Reports from scientific surveys
DTU Aqua collects a lot of data at sea about the state of fish stocks and the marine environment. On this page you can find reports from recent years with results from the two extensive scientific surveys in the North Sea (IBTS) and in the Kattegat and Baltic Sea (BITS).

Denmark is obligated to collect data on fish and shellfish stocks and the marine environment at sea according to the EU Data Collection Framework (EU-2021/1168). As part of this, DTU Aqua conducts several different scientific surveys every year. Data from some of these surveys is available further down this page.
The data collection is coordinated internationally
Most of the scientific surveys are coordinated internationally by the International Council for the Exploration of the Sea, ICES. Several countries contribute to the data collection, and collectively they cover the entire survey area. In addition, survey protocols have been developed to standardize data collection. On the ICES website you can find information about protocols and download survey data from the participating countries.
Data from the surveys is part of the basis for the biological advice provided by ICES, which authorities and politicians use when setting quotas and other rules for fisheries.
Data reports from surveys in the North Sea, Kattegat and the Baltic Sea
The “raw” data from the surveys available on the ICES website can be difficult to utilize without expert knowledge. Therefore, DTU Aqua has created more accessible reports with Danish results from two key scientific surveys: International Bottom Trawl Survey (IBTS) and Baltic International Trawl Survey (BITS).
DTU Aqua conducts other scientific surveys in accordance with the EU Data Collection Framework. There are no easily accessible reports for these surveys, but data can always be found on the ICES website.
How to read the reports - see further down the page.

Baltic International Trawl Survey (BITS)
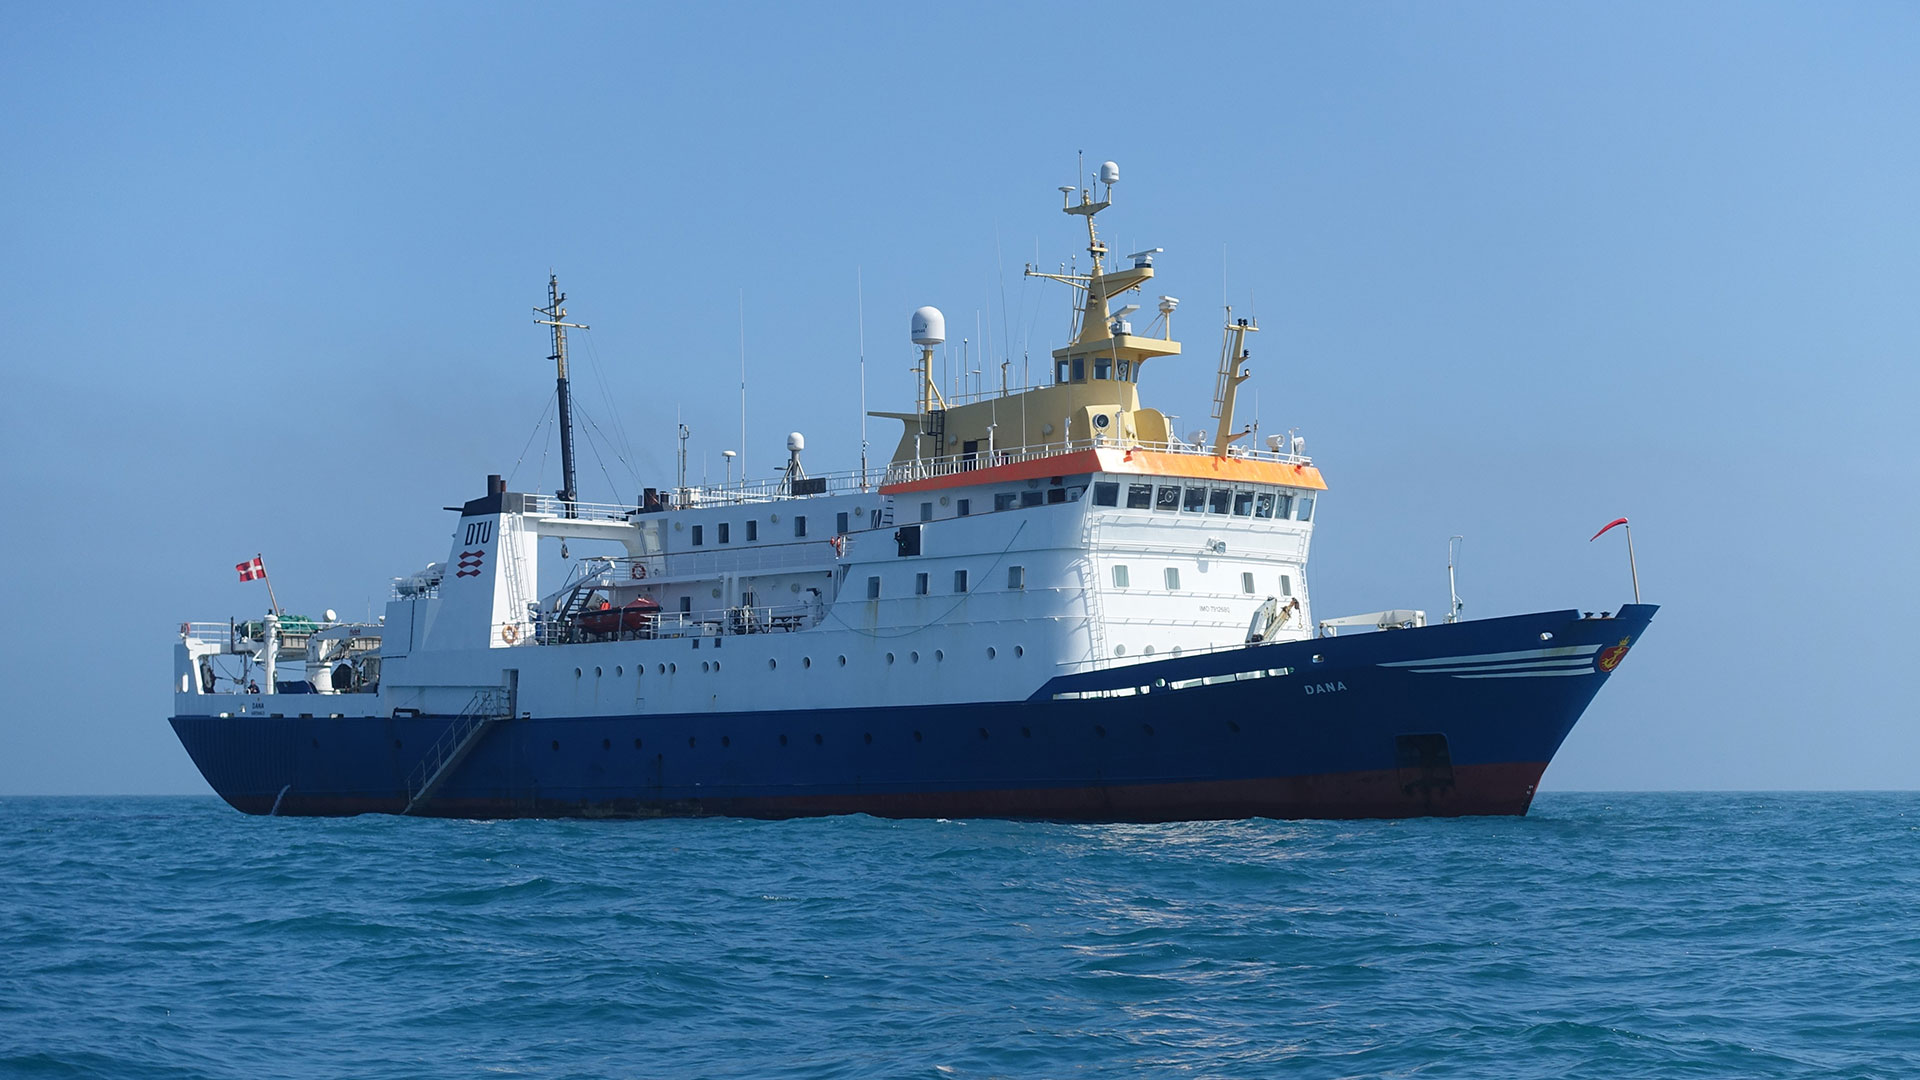
The reports show selected results from the Danish part of BITS. The survey is conducted in Kattegat and the Baltic Sea with the research vessels Dana and Havfisken every year in the first and fourth quarter.
How to read the reports
Year and quarter
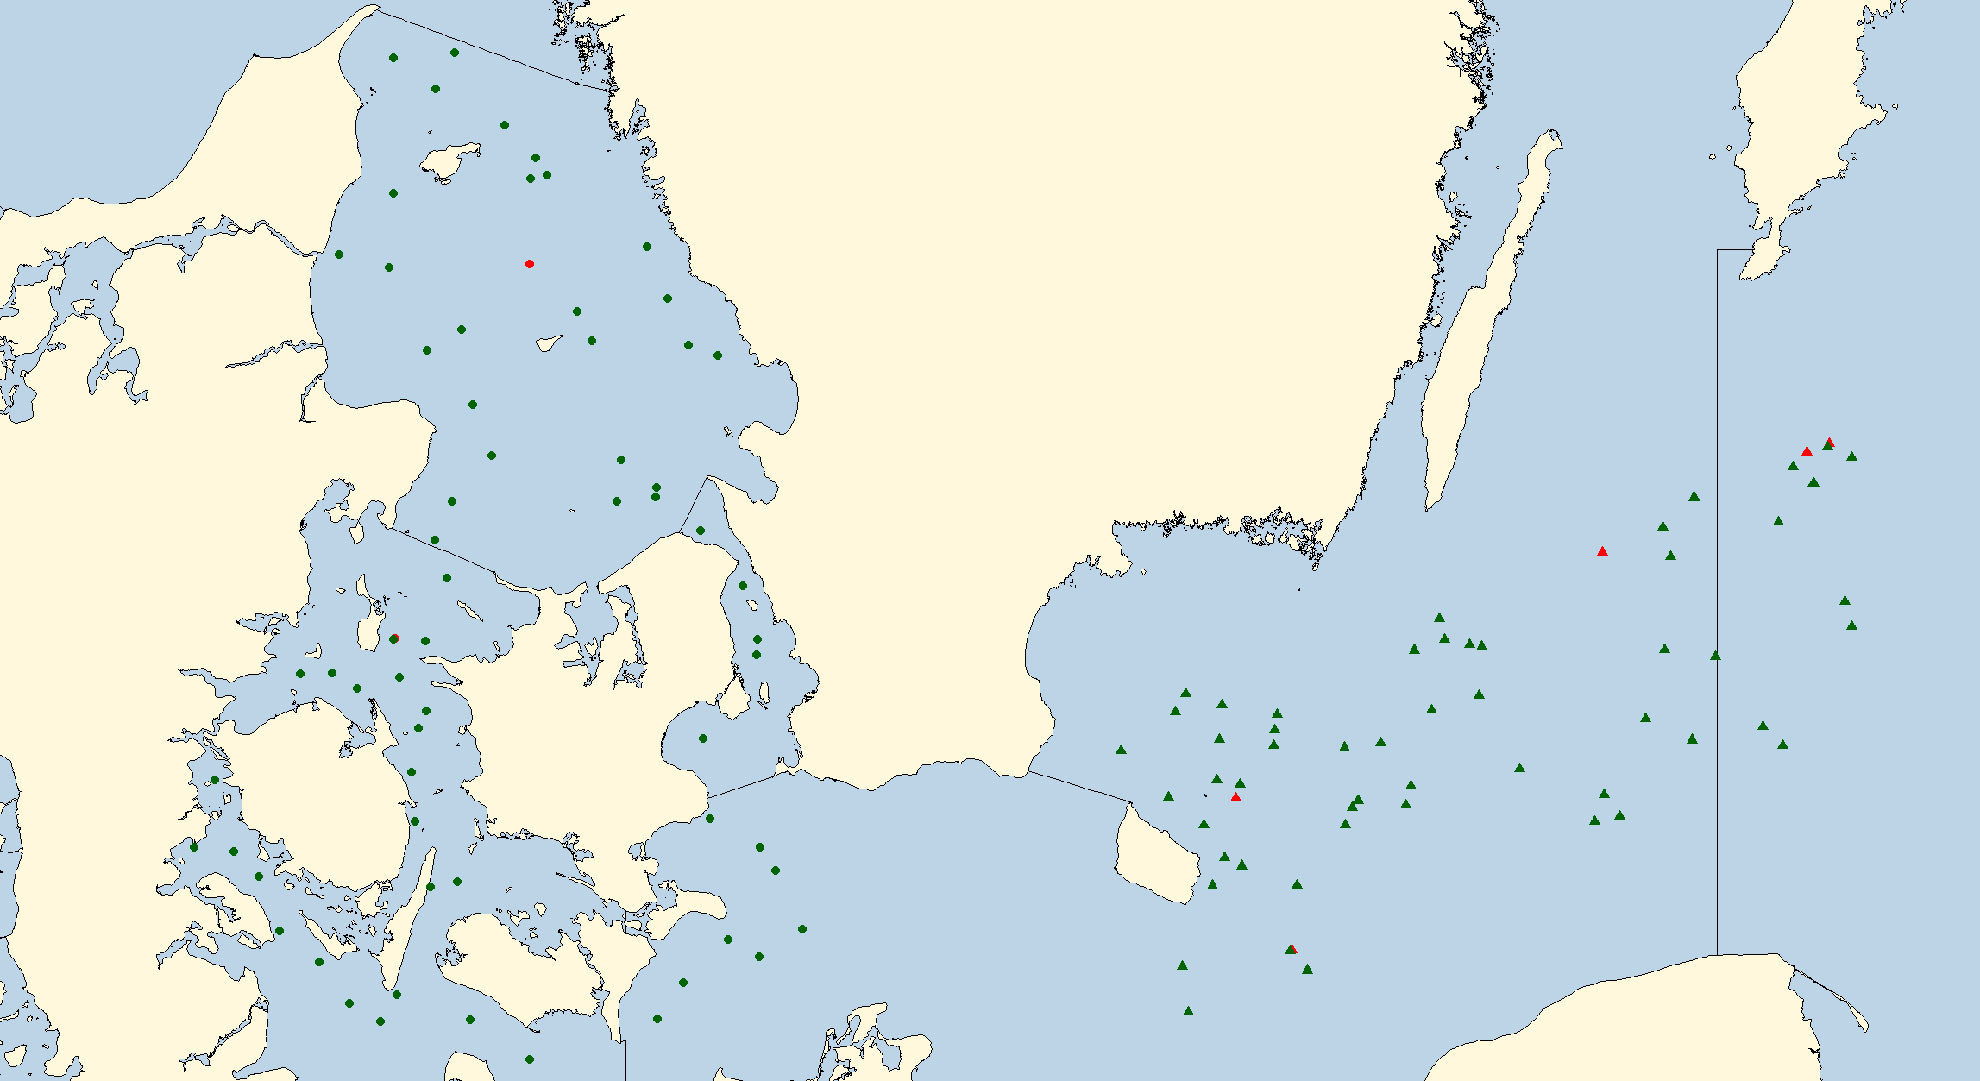
Each report represents a year. In the reports, a quarter can be selected. Once the quarter is specified, information on station type can be visualized (trawl, plankton or hydrographic stations) and whether the stations are valid (green) or invalid (red). You can also see which vessel carried out the surveys.
Trawl stations
On the surveys, trawling is done at specific stations. Fishing is limited to 30 minutes and the gear is used in the same way year after year to take comparable samples of the fish stocks in the area. At trawl stations, scientific gear with a smaller mesh size than used in commercial fisheries is applied to capture fish from the incoming year classes (recruits). Recruit data tells how fish stocks will develop and thus provides information about future fishing opportunities.
Plankton stations (Bongo stations)
At the plankton stations, i.e. the stations where samples of smaller zooplankton and phytoplankton are collected, a specialized tool (bongo net) is used. It is much smaller than a fishing trawl. It is dredged through the water column to monitor zooplankton, including fish larvae and eggs, jellyfish and phytoplankton. This data is collected to study the condition of different species of fish larvae and to monitor the spread of the invasive comb jelly, among other things.
CTD stations
The final tool you can see on the plot in the reports is the CTD (conductivity, temperature, and depth). This is an instrument that is lowered through the water column at each trawl station measuring oxygen, salinity and temperature at each depth. The graph displayed in the survey reports (CTD results) shows the levels two meters above the bottom. These results are used to document environmental conditions in the marine areas. Particularly oxygen levels at the bottom have a major influence on the many bottom-dwelling organisms.
Catch overview
The reports contain an overview of the main catches from the entire trip, in terms of weight and number. It is also available with more detailed information on catch by sub-areas. For detailed information on catches by station, the catch per unit effort (CPUE) for selected species can be used.
The size of the bubbles indicates the number of selected species in the catch. If the dot is green, there has been at least one fish of the selected species; if the dot is red, no fish of the selected species were present at that station. Additionally, a plot shows the number of registered species by station as a proxy for biodiversity.
For the same selected species, length distribution can be visualized for the entire survey.
Contact
Marie Storr-Paulsen Head of Section National Institute of Aquatic Resources msp@aqua.dtu.dk
Contact
Kai Ulrich Wieland Head of Section National Institute of Aquatic Resources kw@aqua.dtu.dk

